Four years ago I blogged about the fact that medal counts are often reported on a per-country basis without regard for the population of any country. I’ve always thought that approach to be silly. The per-capita medal count is much more interesting to me.
So this morning I used Bing to get the latest count by country of gold medals at the ongoing Rio Olympics. I included only those nations that have won two or more gold medals.
I then visited Wikipedia to get recent population counts for those nations.
I used all this data to determine the per-capita win per nation and ranked them. The results are below.
| Ranking | Country | Per Capita Ratio (Descending Order) |
Gold Medal Count | Population | Date Population Reported |
|---|---|---|---|---|---|
| 1 | Jamaica | 7.34418E-07 | 2 | 2,723,246 | 31-Dec-14 |
| 2 | New Zealand | 6.37423E-07 | 3 | 4,706,450 | 16-Aug-16 |
| 3 | Hungary | 6.10811E-07 | 6 | 9,823,000 | 1-Jan-16 |
| 4 | Croatia | 4.77251E-07 | 2 | 4,190,669 | 31-Dec-15 |
| 5 | Netherlands | 3.52389E-07 | 6 | 17,026,640 | 16-Aug-16 |
| 6 | Australia | 2.48343E-07 | 6 | 24,160,100 | 16-Aug-16 |
| 7 | United Kingdom | 2.45738E-07 | 16 | 65,110,000 | 30-Jun-15 |
| 8 | Switzerland | 2.39762E-07 | 2 | 8,341,600 | 31-Mar-16 |
| 9 | Greece | 1.84196E-07 | 2 | 10,858,018 | 1-Jan-15 |
| 10 | Cuba | 1.77952E-07 | 2 | 11,239,004 | 31-Dec-15 |
| 11 | Belgium | 1.76637E-07 | 2 | 11,322,674 | 1-Jun-16 |
| 12 | Italy | 1.31871E-07 | 8 | 60,665,551 | 1-Jan-16 |
| 13 | South Korea | 1.18107E-07 | 6 | 50,801,405 | 1-Jul-16 |
| 14 | Kazakhstan | 1.12656E-07 | 2 | 17,753,200 | 1-May-16 |
| 15 | Germany | 1.10064E-07 | 9 | 81,770,900 | 30-Sep-15 |
| 16 | France | 1.04891E-07 | 7 | 66,736,000 | 1-Jul-16 |
| 17 | Spain | 8.61356E-08 | 4 | 46,438,422 | 1-Jan-16 |
| 18 | United States | 8.01855E-08 | 26 | 324,248,000 | 16-Aug-16 |
| 19 | North Korea | 7.91108E-08 | 2 | 25,281,000 | 1-Jul-16 |
| 20 | Russia | 7.50345E-08 | 11 | 146,599,183 | 1-May-16 |
| 21 | Uzbekistan | 6.33406E-08 | 2 | 31,575,300 | 1-Jan-16 |
| 22 | Canada | 5.53166E-08 | 2 | 36,155,487 | 1-Apr-16 |
| 23 | Japan | 5.51225E-08 | 7 | 126,990,000 | 1-Jul-16 |
| 24 | Poland | 5.20329E-08 | 2 | 38,437,239 | 31-Dec-15 |
| 25 | Kenya | 4.52934E-08 | 2 | 44,156,577 | 1-Jul-15 |
| 26 | Colombia | 4.09887E-08 | 2 | 48,793,900 | 16-Aug-16 |
| 27 | Thailand | 3.04279E-08 | 2 | 65,729,098 | 31-Dec-15 |
| 28 | Iran | 2.51689E-08 | 2 | 79,463,100 | 16-Aug-16 |
| 29 | China | 1.08836E-08 | 15 | 1,378,220,000 | 16-Aug-16 |
| 30 | Brazil | 9.68457E-09 | 2 | 206,514,000 | 16-Aug-16 |
You could argue that some country populations and/or medal counts are too small to prove anything other than an interesting anomaly. Or not. But there’s no question that Hungary and the Netherlands are very impressive, each with six gold medals for an overall per-capita rate that’s dramatically higher than, for example, Great Britain, the United States, and especially China, who – in spite of their very high medal count, is actually very far behind the other nations on a per capita basis.
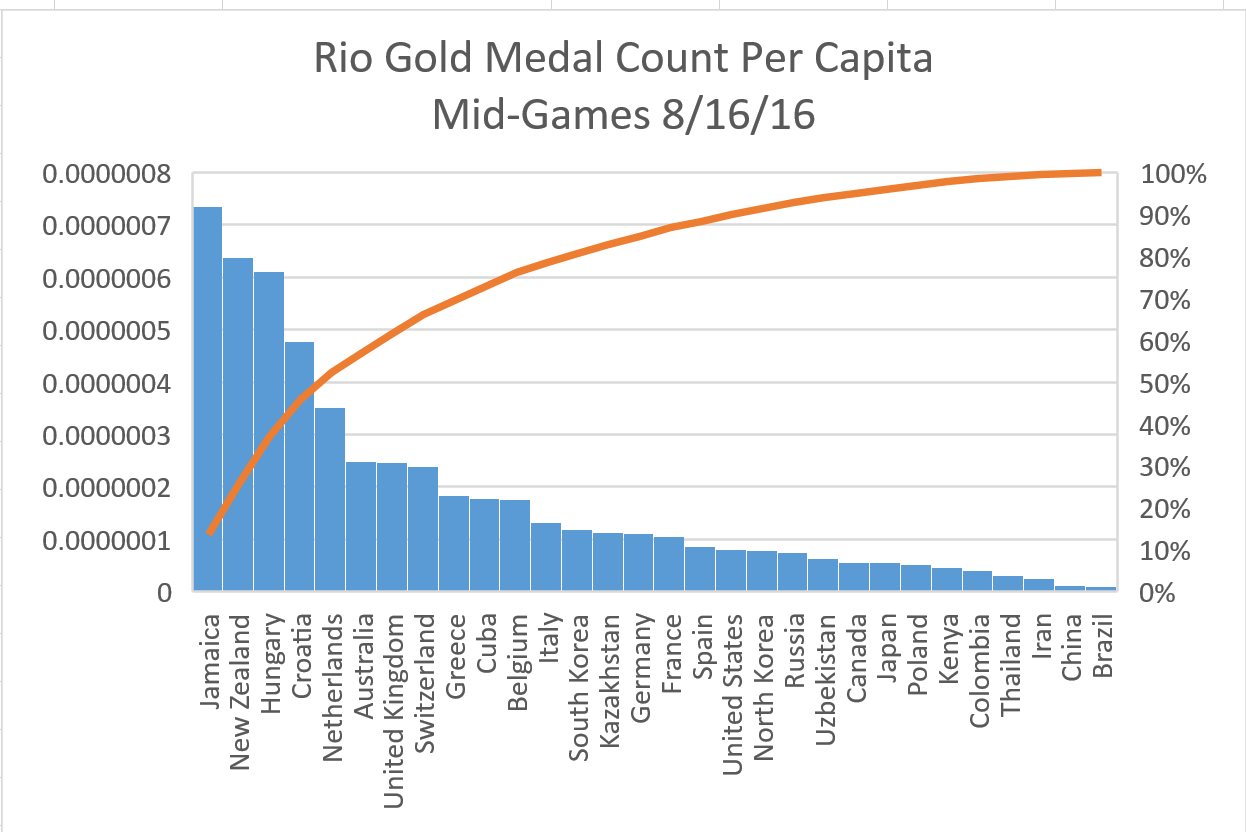
These are the results presented graphically, which I created using Microsoft Excel, captured with the built-in “snipping” tool in Microsoft Windows: :
The Pareto Line seems to curve most significantly above Hungary and the Netherlands, which have the most striking performance in terms of size of population and count of gold medals. Also – note how far back China ranks. They might have a lot of medals, but they also have the largest population in the world.
To me, this sort of analysis is much more interesting than the simple medal count that doesn’t account for population.
Sources:
- Gold Medal Count as of 8/16/2016: http://www.bing.com/search?pc=COSP&ptag=D073116-A855B9C56E1&form=CONBDF&conlogo=CT3335450&q=gold+medal+count+by+country
- Country Population Data: https://en.wikipedia.org/wiki/List_of_countries_and_dependencies_by_population
